Node tabs
Properties
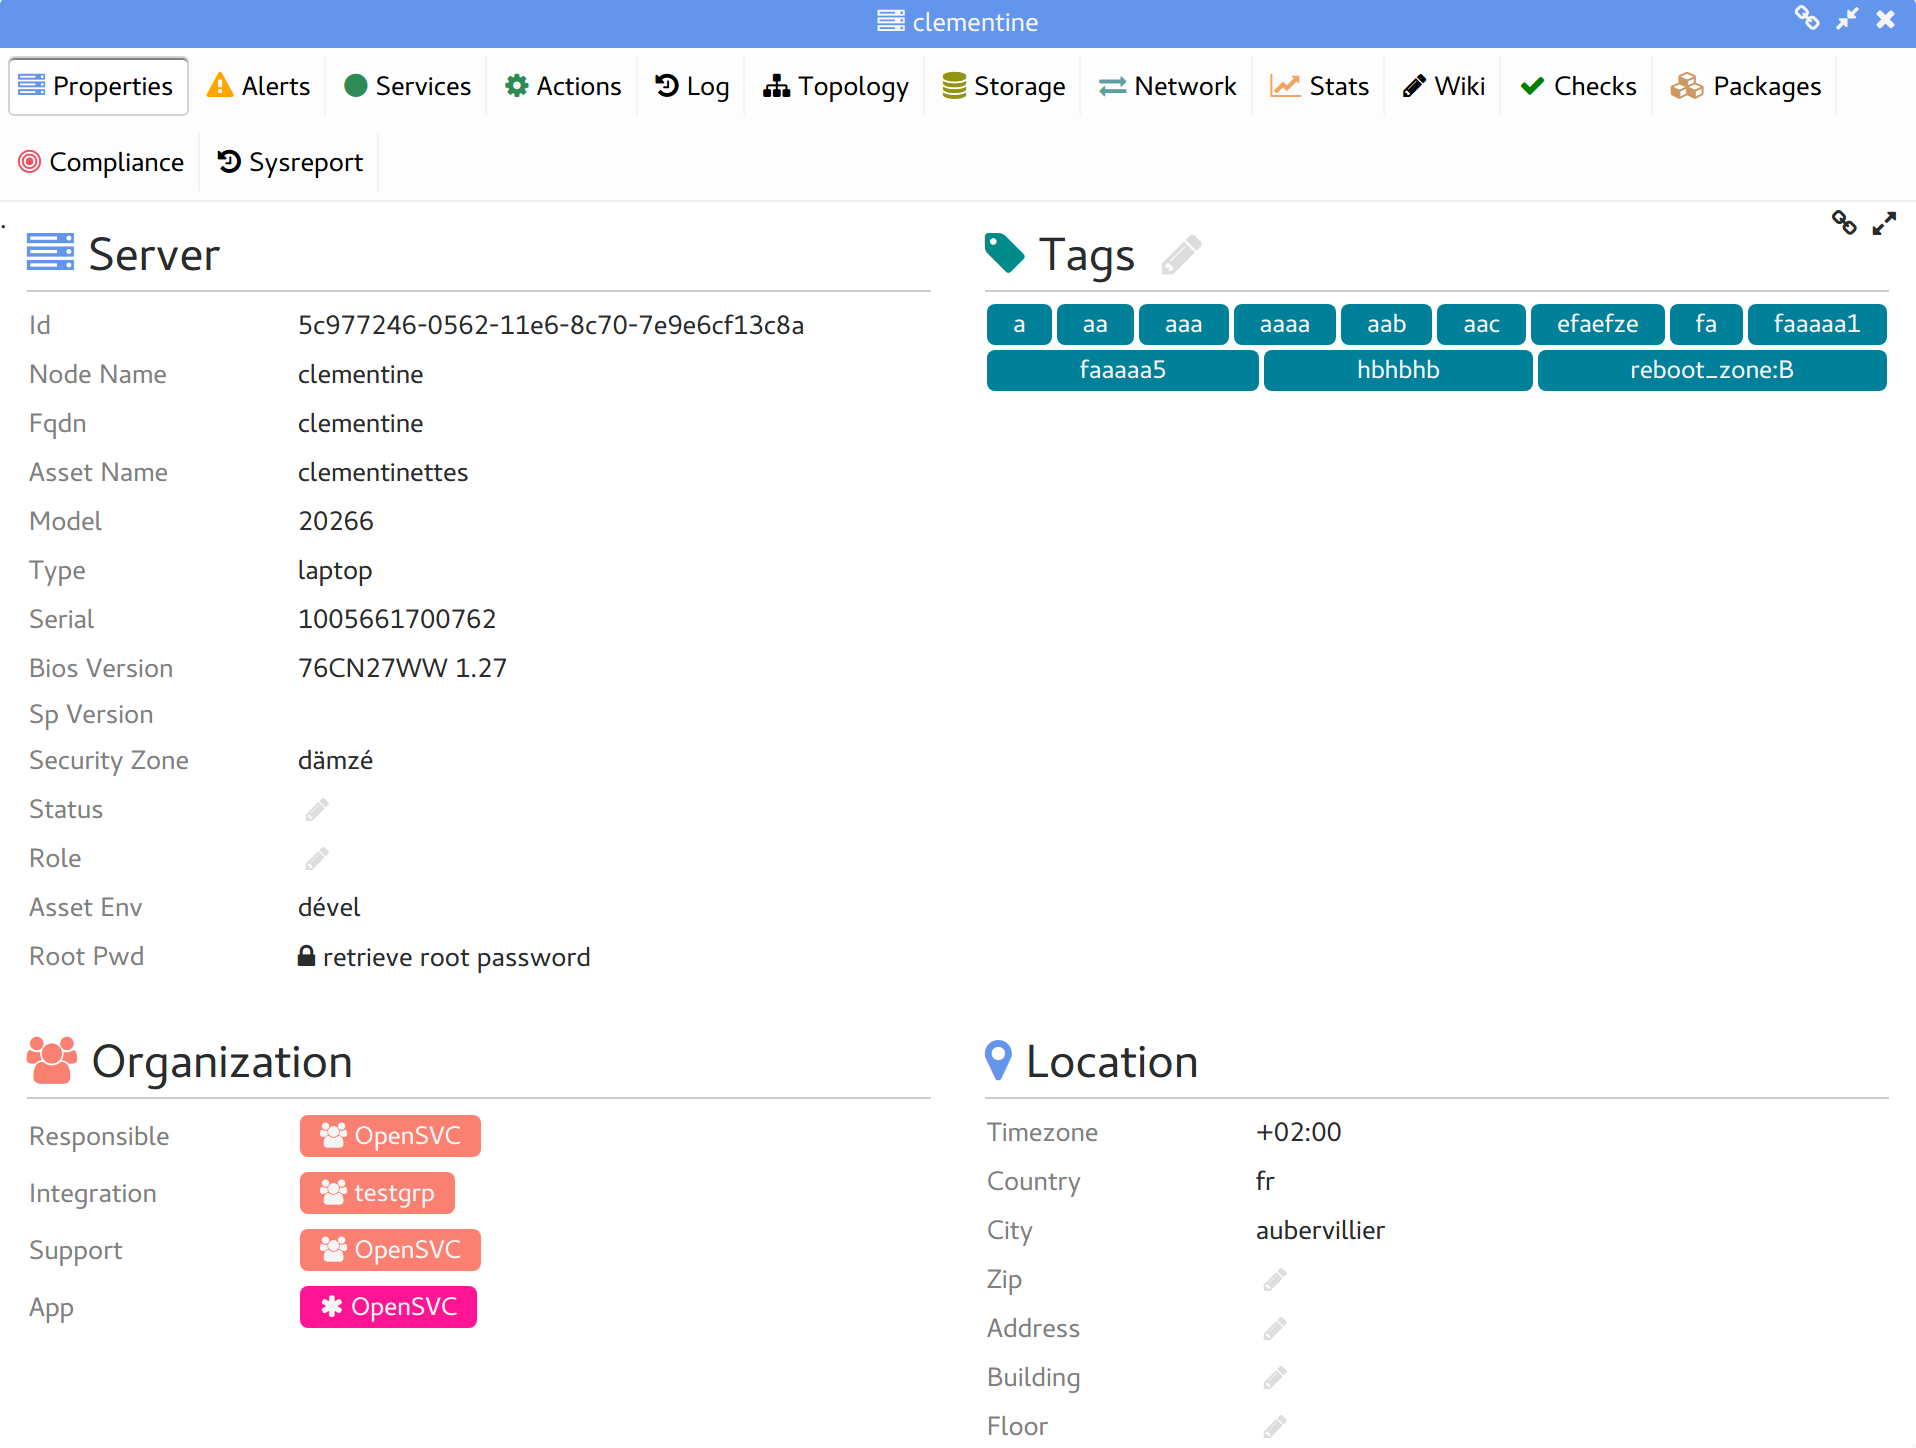
Asset information can be loaded from a tiers enterprise asset manager or filled-in manually.
Alerts
The dashboard table filtered to display only the node alerts.
Services
The service instances table filtered to display only the node’s service instances.
Actions
The service actions table filtered to display only the node’s service actions.
Logs
The logs table filtered to display only the node entries.
Storage
Display:
The node-to-array cabling through the SAN
A table of the node host bus adapter information
A table of the node host bus adapter-to-target ports information, with used SAN views
A table of the node disks, with their information parsed from storage arrays
Networks
The nodes ips table filtered to display only the node ips and related information from the network CMDB.
Stats
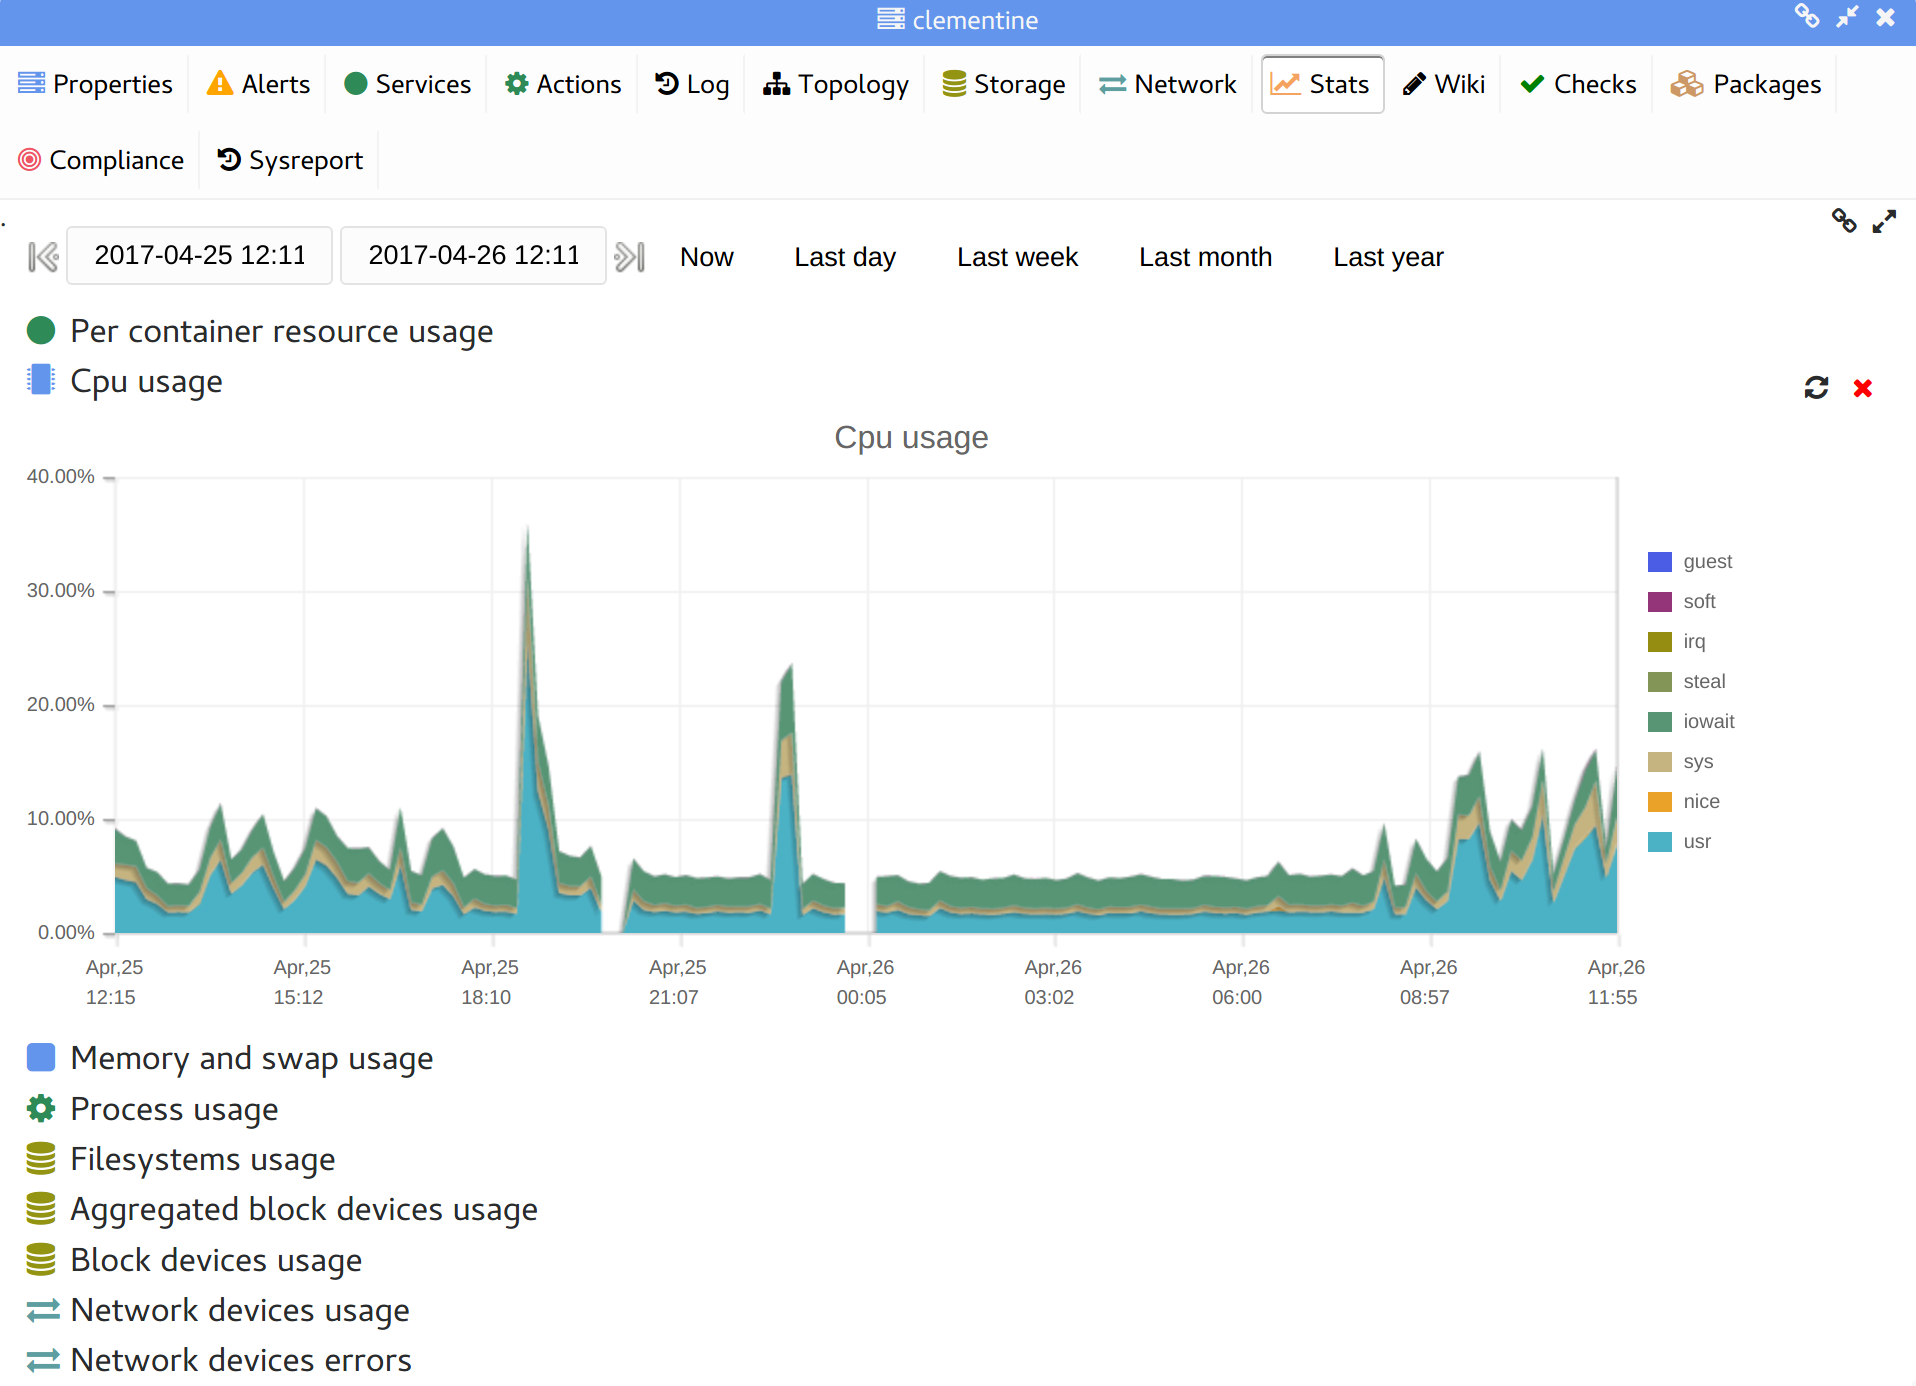
Generate and display graphs of performance metrics on the user-selected time range. The metrics are gathered daily from tools like glance and sar running on the nodes. The opensvc agent pushes this information to database.
Metrics collection depend on the operating system. Some of them are:
cpu: usr, sys, wait, irq, guest, steal, idle, nice, iowait, soft
mem: commit, free, used by usr, buffer, cache, sys
swap: free, used, used but cached
load: avg1, avg5, avg15, runq size, proc list size
all-disks: io/s, bandwidth
per-disk: io/s, request size, wait time, service time, %util, bandwidth
Packages
The nodes packages table filtered to display only the node packages.
Compliance
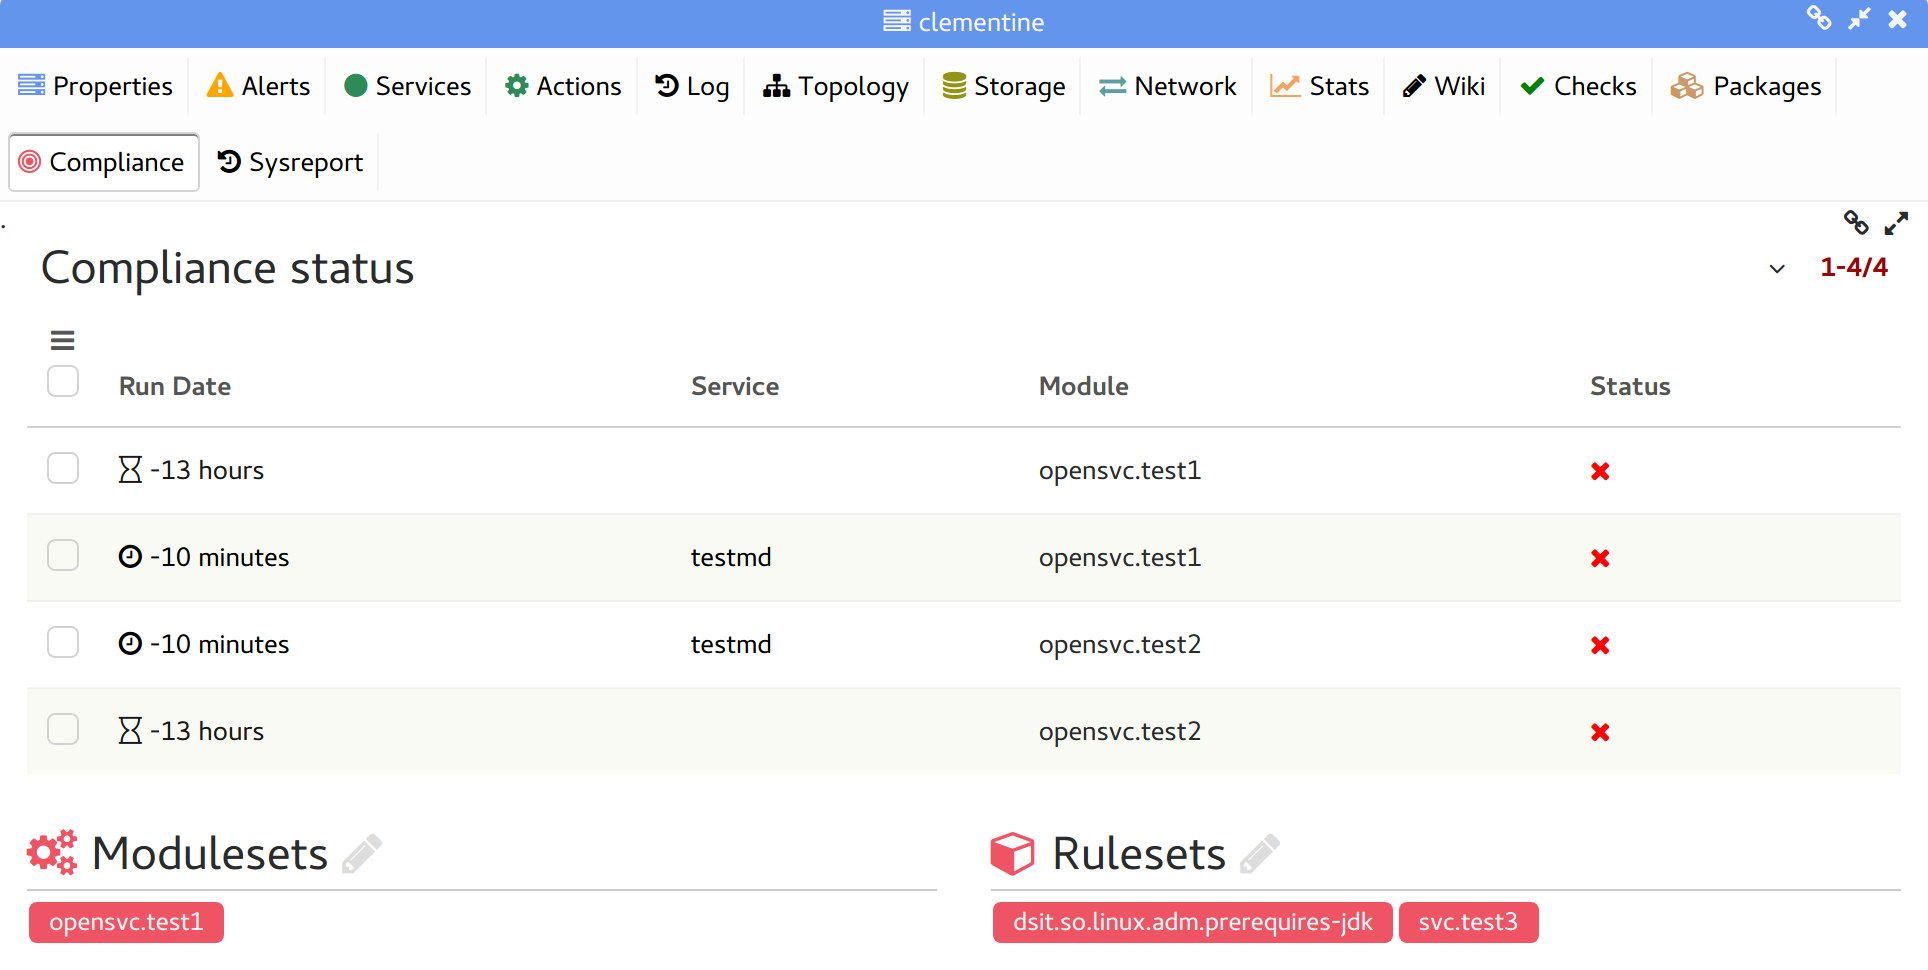
Displays:
The current per-module compliance status of the node
The node rulesets and modulesets attachments
Compliance alerts details
Sysreport
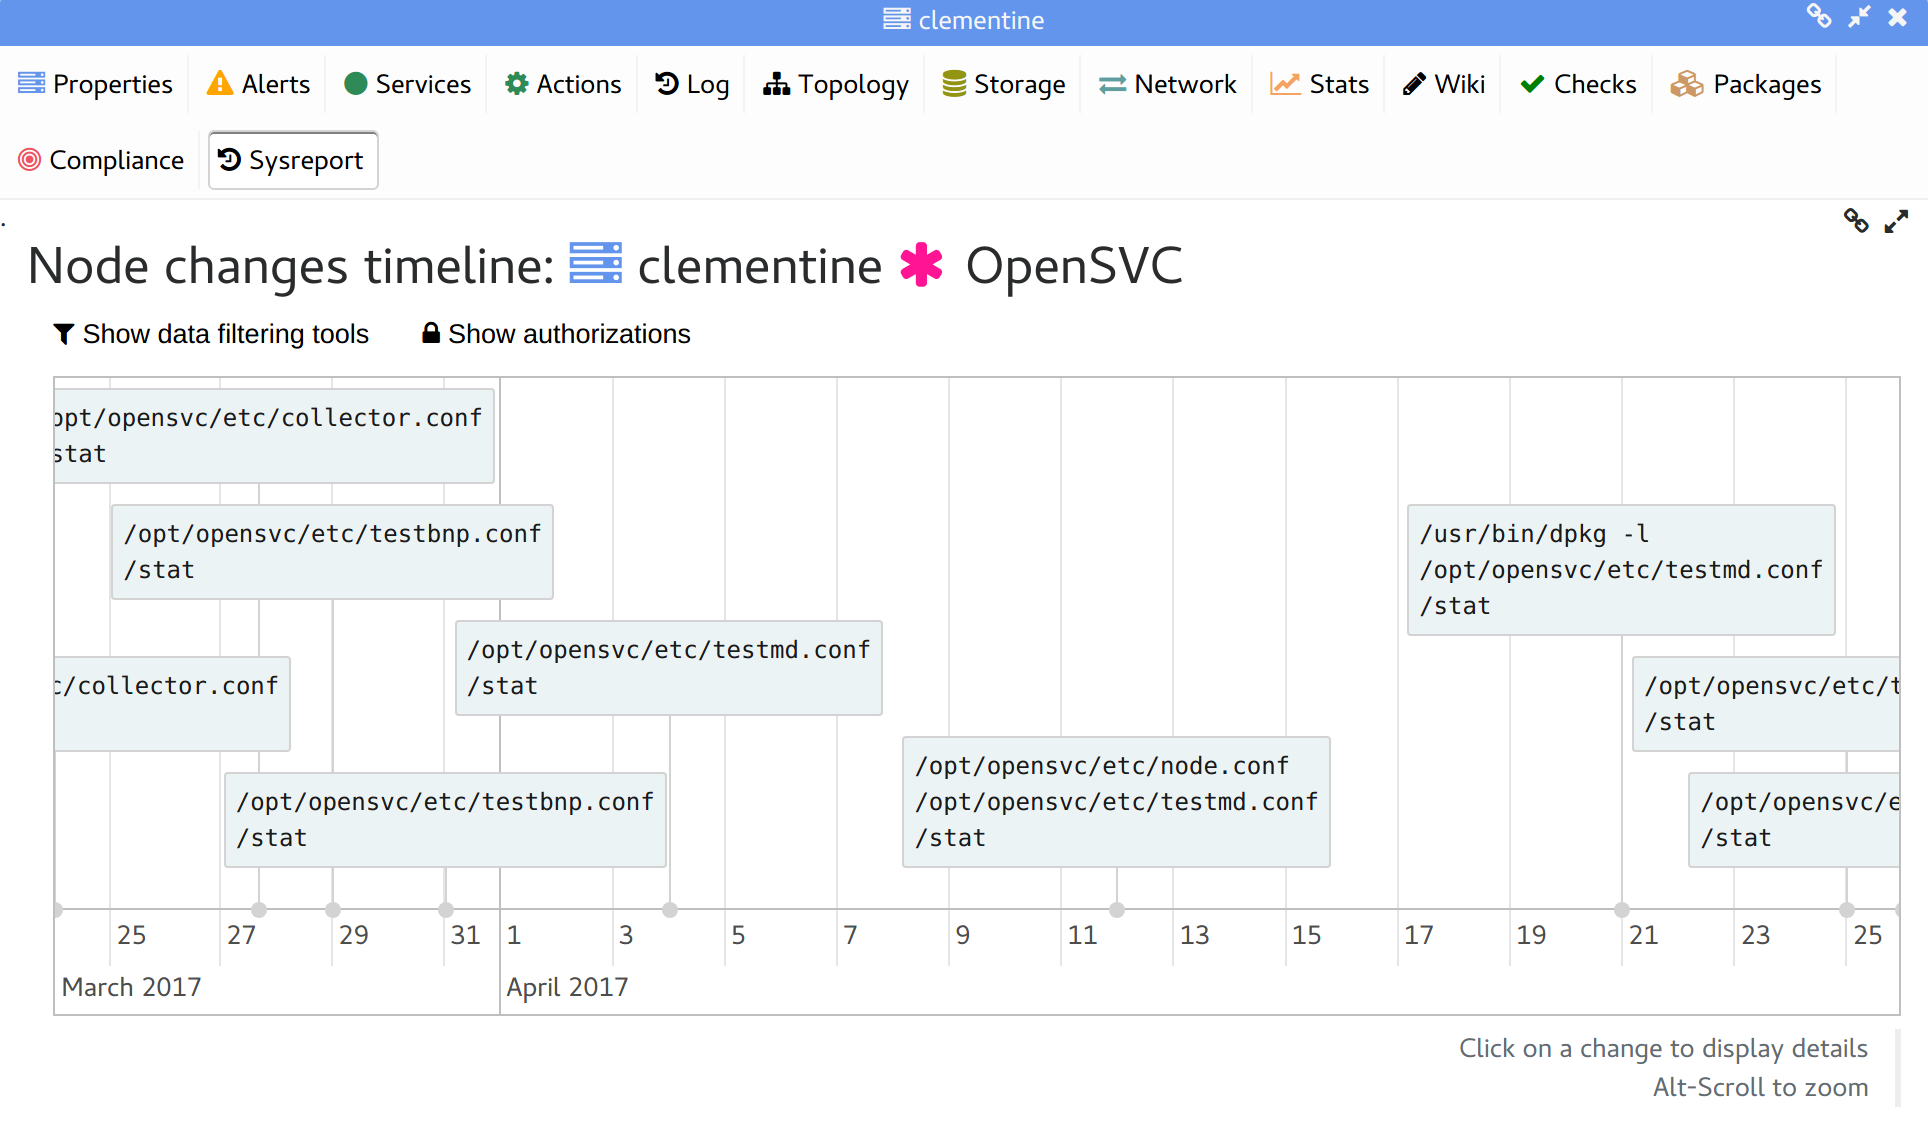
A timeline showing changed files on the node over time.
Changes can be filtered by path and time range.
Clicking a change in the timeline displays the change details: per file diff, files content at the time.
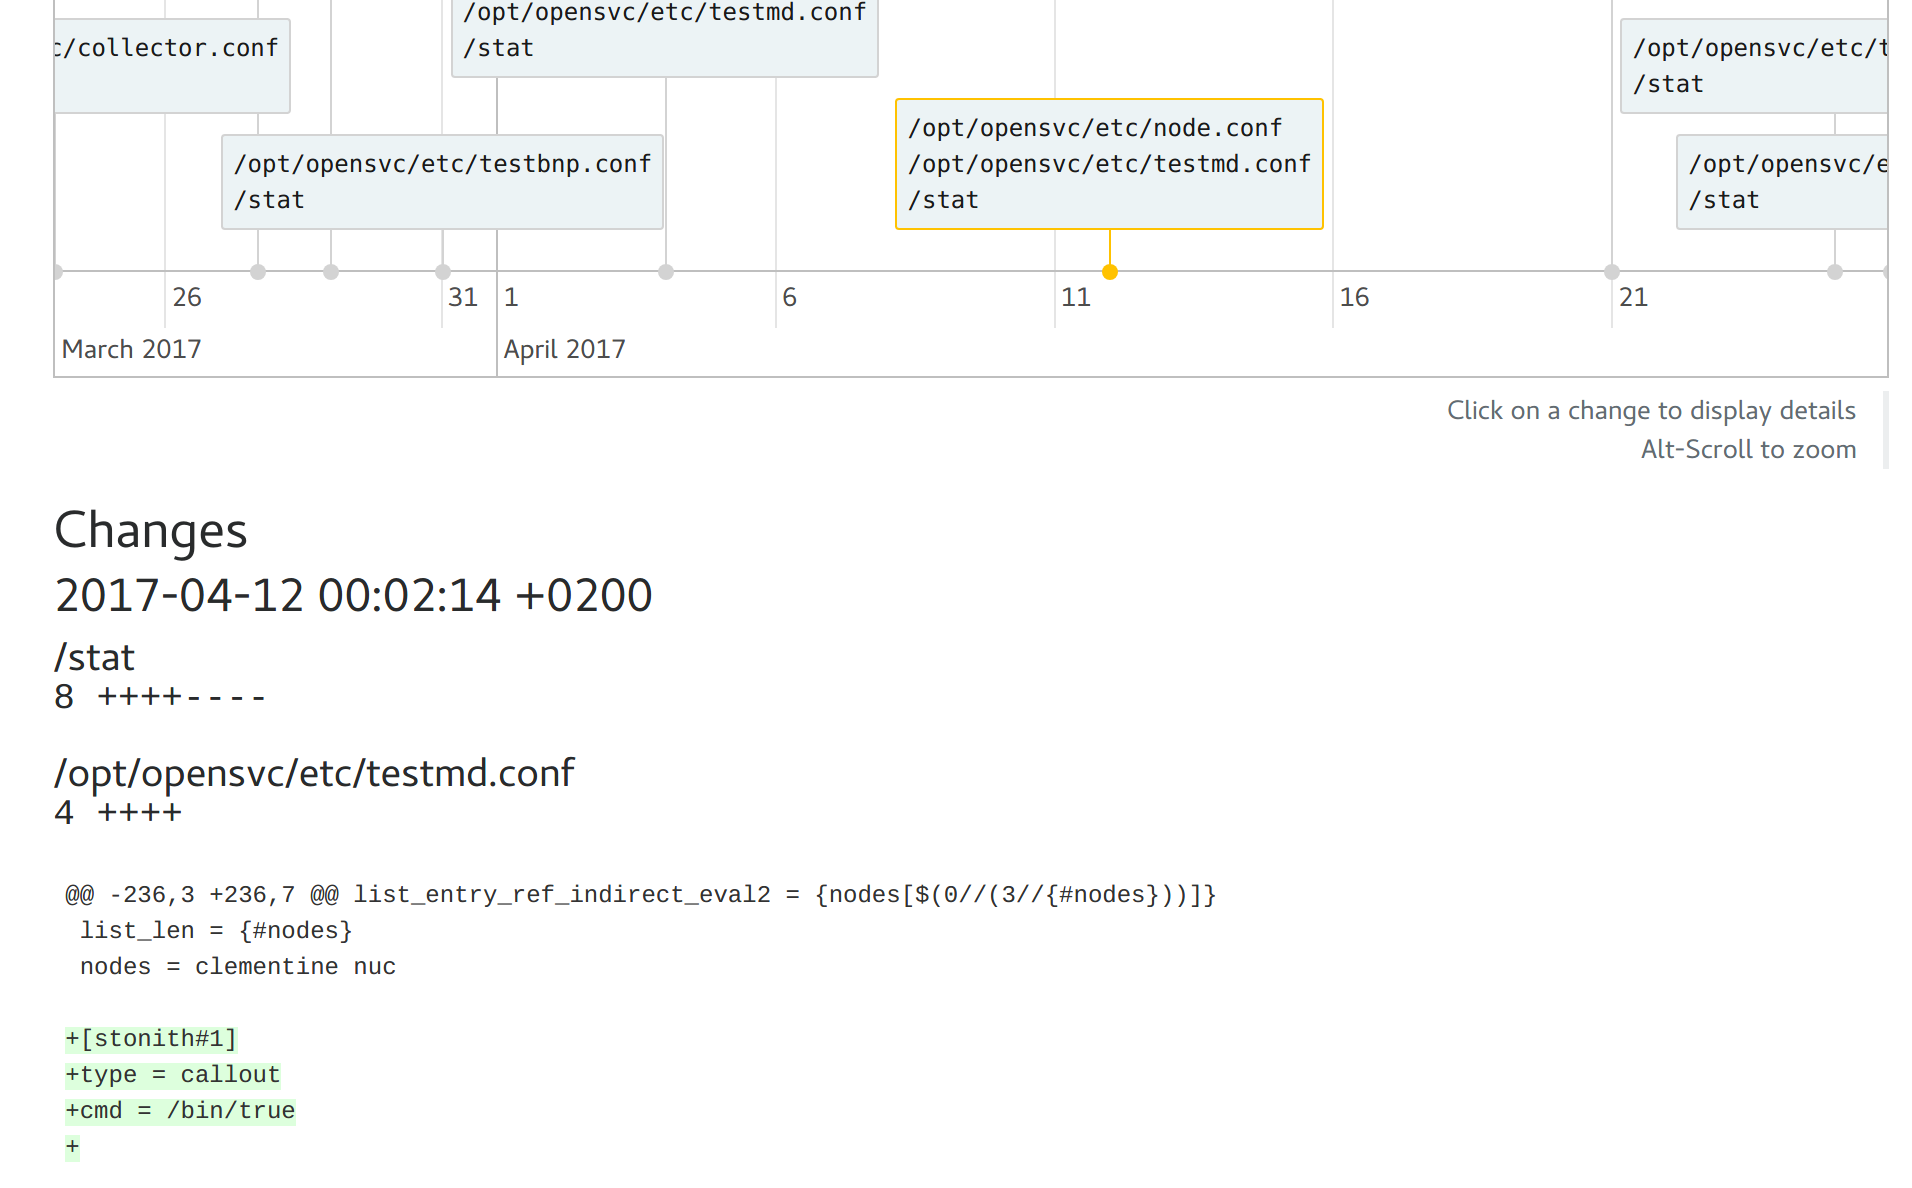
Selecting a time range produces a consolidated diff between the begin and end dates.